Idealized-temperature-profiles-of-the-near-surface-layer-10-m-depth-of-the-ocean.png
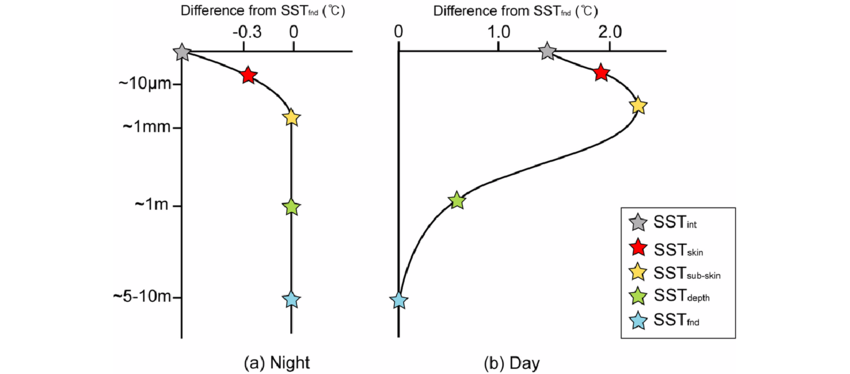
Idealized temperature profiles of the near-surface layer (10-m depth)
of the ocean. Schematic diagram showing (a) idealized night-time
vertical temperature deviations from SST fnd (foundation SST) and (b)
idealized day-time vertical temperature deviations from SST fnd in the
upper ocean (The GHRSST-PP International Project Office 2008; Donlon
et al. 2002)
Cartoon_near-surface_vert_temp_grad.jpg
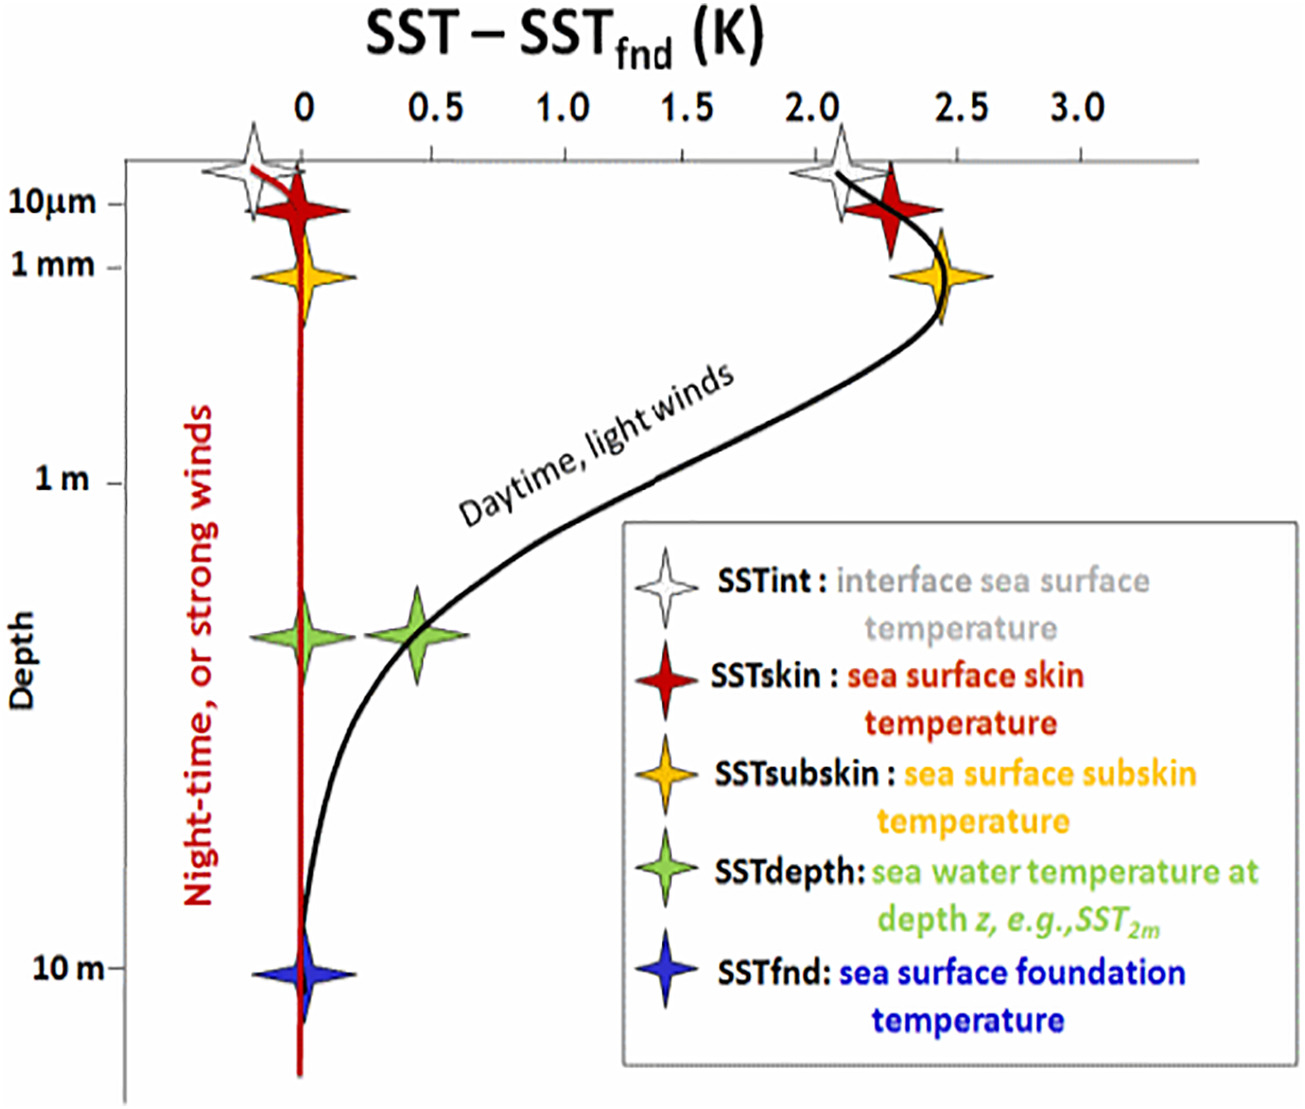
Different types of SST based on a hypothetical vertical
profile. Reproduced from the GHRSST website.
This figure is shown by Minnett et al. (2019)
as their
Fig. 2. Near-surface oceanic temperature gradients. From Minnett and
Kaiser-Weiss (2012).
with a citation from
Minnett
& Kaiser-Weiss (2012)
as their
Figure 1. Cartoon of
near-surface temperature gradients. The numbers on the axes are for
guidance only and to not represent rigorously derived
scales. Variability exists in both the temperature and depth scales.