The success of the AML model's surface flux simulation suggests that it may be possible to simulate SST anomalies by coupling the AML model to a model of the ocean mixed layer. We assume the simplest of ocean mixed layers: a uniform, well mixed, 75m deep layer that is decoupled from the water below. Knowing the climatological mean fluxes from the runs with imposed SSTs we integrate an equation for the SST anomaly that is forced by flux anomalies. The anomalies are computed by subtracting the modeled climatological mean fluxes from the total flux computed by the AML model using the observed climatological mean SST plus the modeled SST anomaly. The equation for the SST anomaly is:
![\begin{displaymath}\frac{\partial T'}{\partial t} =
\frac{1}{\rho c_pH}\left[Q(T'+\bar{T}_{obs})-Q(\bar{T}_{obs})\right].
\end{displaymath}](img30.gif) |
(5) |
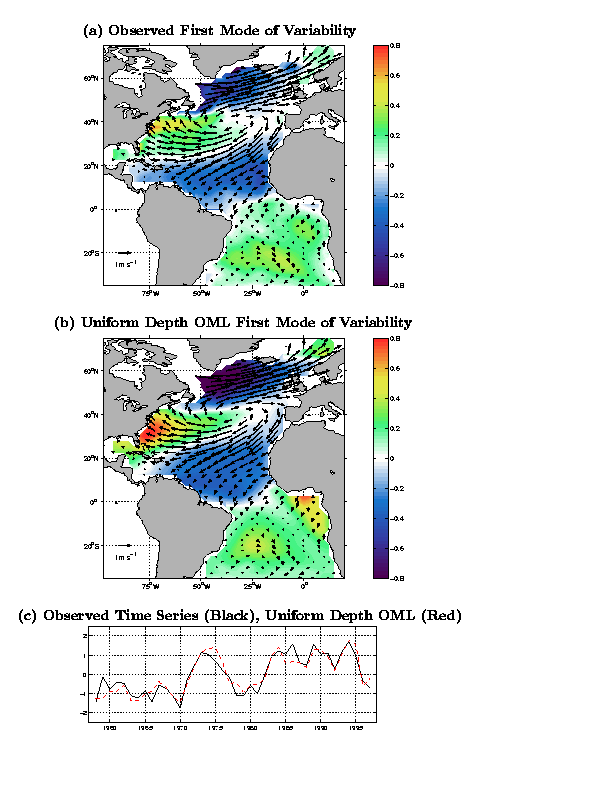
In order to evaluate the observed and modeled variability we perform analyses by singular value decomposition (SVD; Bretherton et al. 1992) between SST and vector wind. The first observed mode of variability, which explains 25% of the variance of SST and 25% and 20% of the variance of zonal and meridional winds during the January to March season, is shown in Figure 6a and the SST time series in Figure 6c. The corresponding modeled patterns and SST time series are shown in Figures 6b and 6c. The observed first mode of variability shows the familiar tripole pattern of SSTs. When the waters are anomalously cold in the high latitude North Atlantic and subtropical North Atlantic they are anomalously warm in the mid-latitudes. The wind pattern that accompanies the SST field shows an anomalous anti-cyclonic circulation whose influence spans the entire North Atlantic. This circulation strengthens the northeast trades inducing ocean cooling. At higher latitudes the mid-latitude westerlies are shifted north compared to climatology and intensify, inducing cooling in the high latitude North Atlantic and warming in the mid-latitude Atlantic. As mentioned in Section 2 advection is also important in some areas. For example, advection of warm moist air poleward aids the warming of waters immediately off the United States coast. The pattern is the North Atlantic Oscillation.
The first mode of the modeled variability during winter is strikingly similar to that observed. The modeled first mode explains 23% of the variance of modeled seasonal SST anomalies. However, a close inspection reveals some differences: the warm anomaly in the mid-latitude Atlantic extends further south in the observations and also has an axis of maximum values in the location of the North Atlantic Current, the cooling of the subpolar gyre is too intense and the model also poorly represents SST anomalies in the Gulf of Guinea. However, the time series of the observed and modeled modes are in good agreement with the model capturing, not only the interannual variability of this pattern, but also the trend from the 1960s to the 1990s.