HITS (Hurricane Interactive Track Simulator) for the North Atlantic Basin
HITS uses a machine learning approach that conditionally samples track segments to simulate new tracks, providing information on all track attributes.
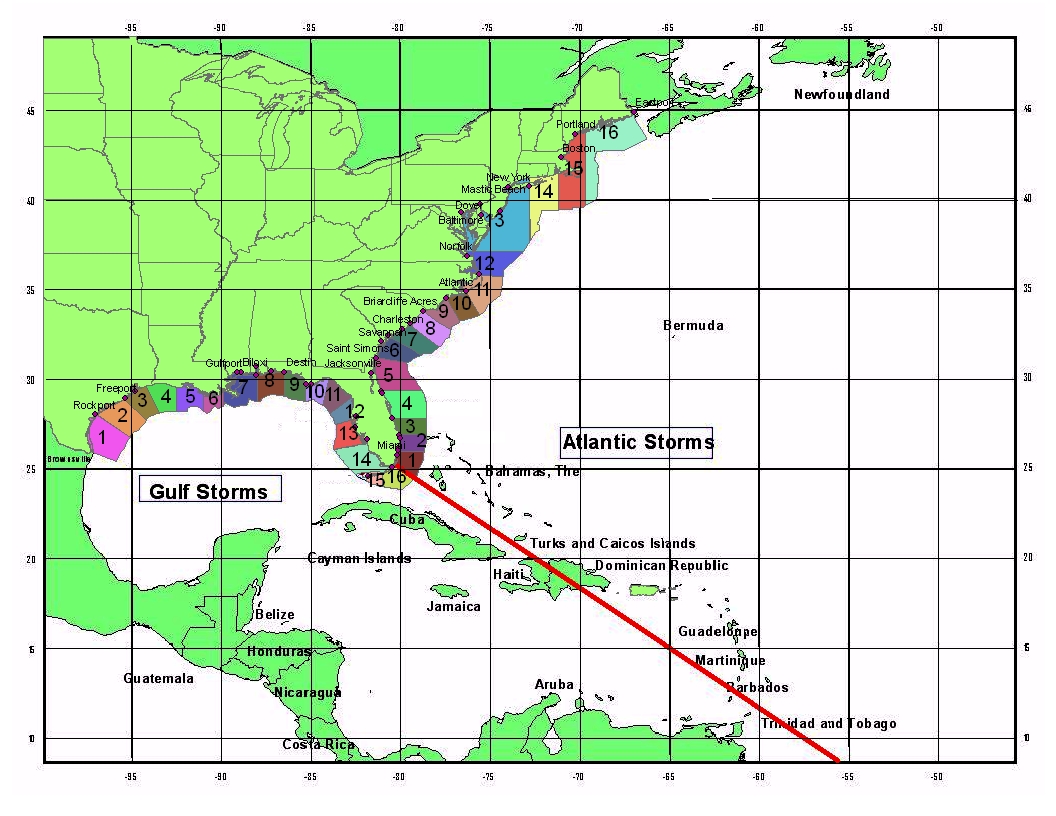
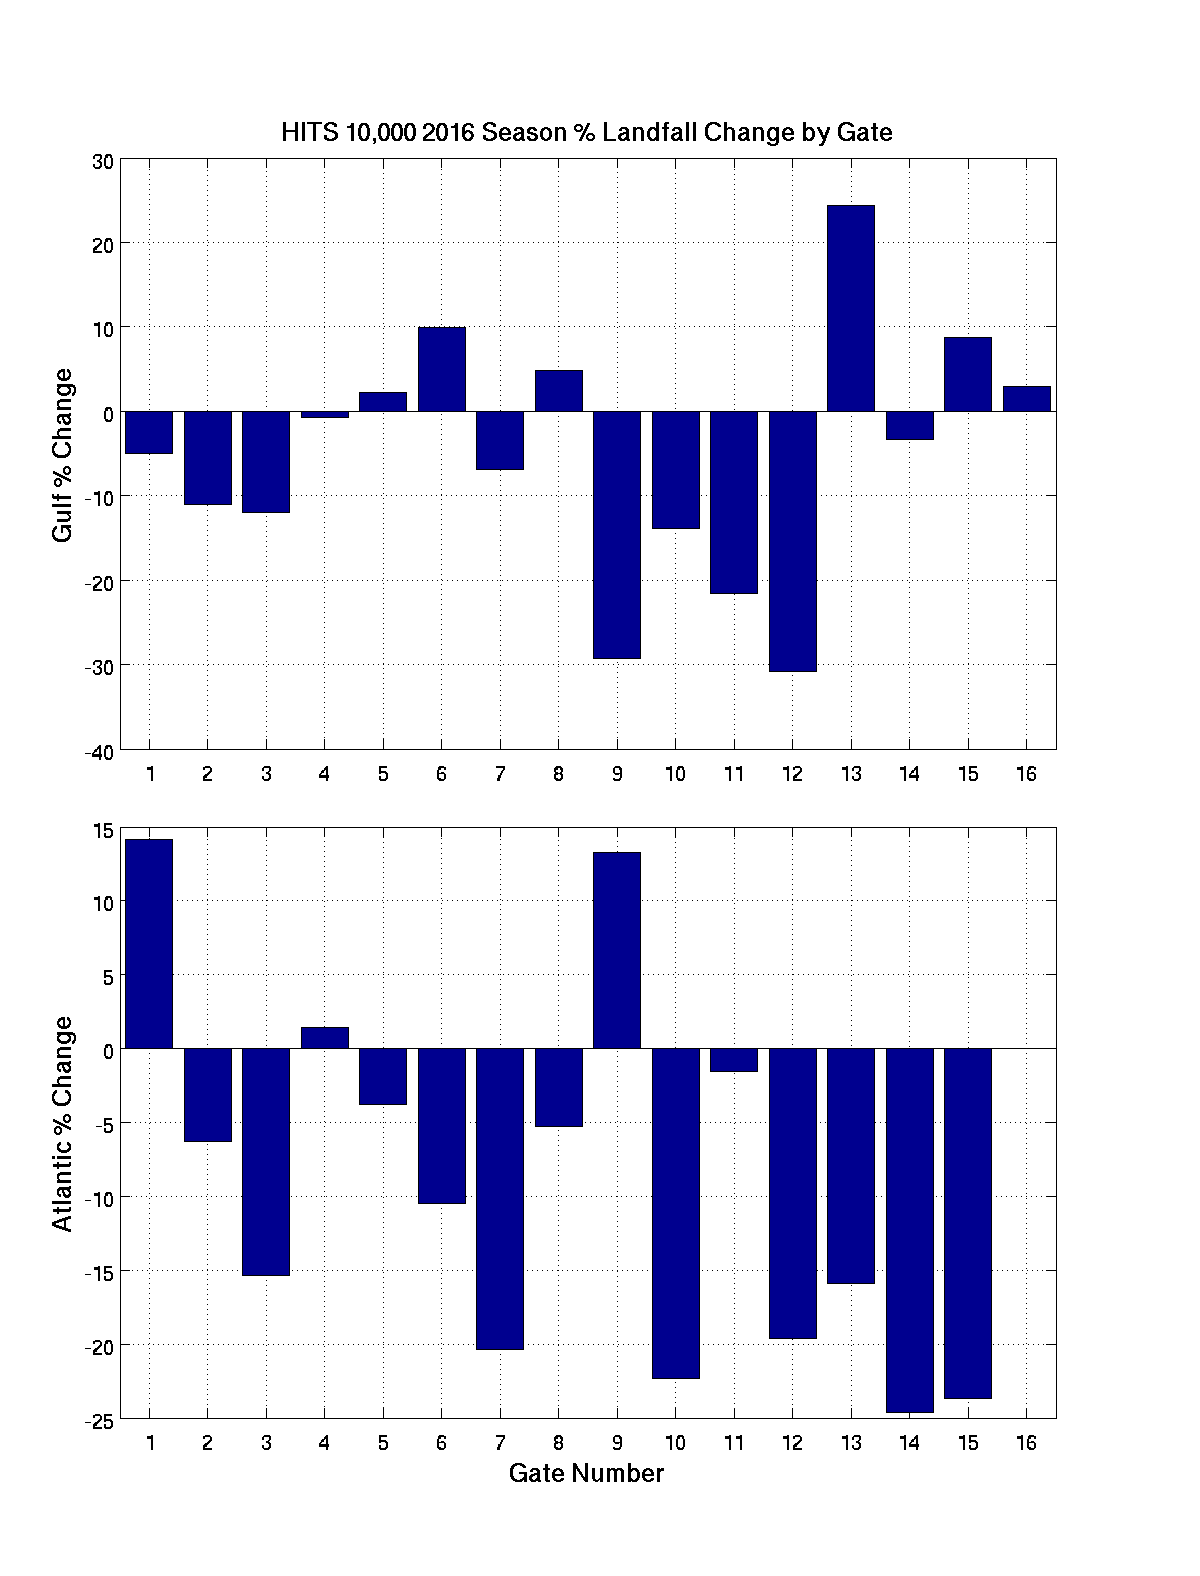
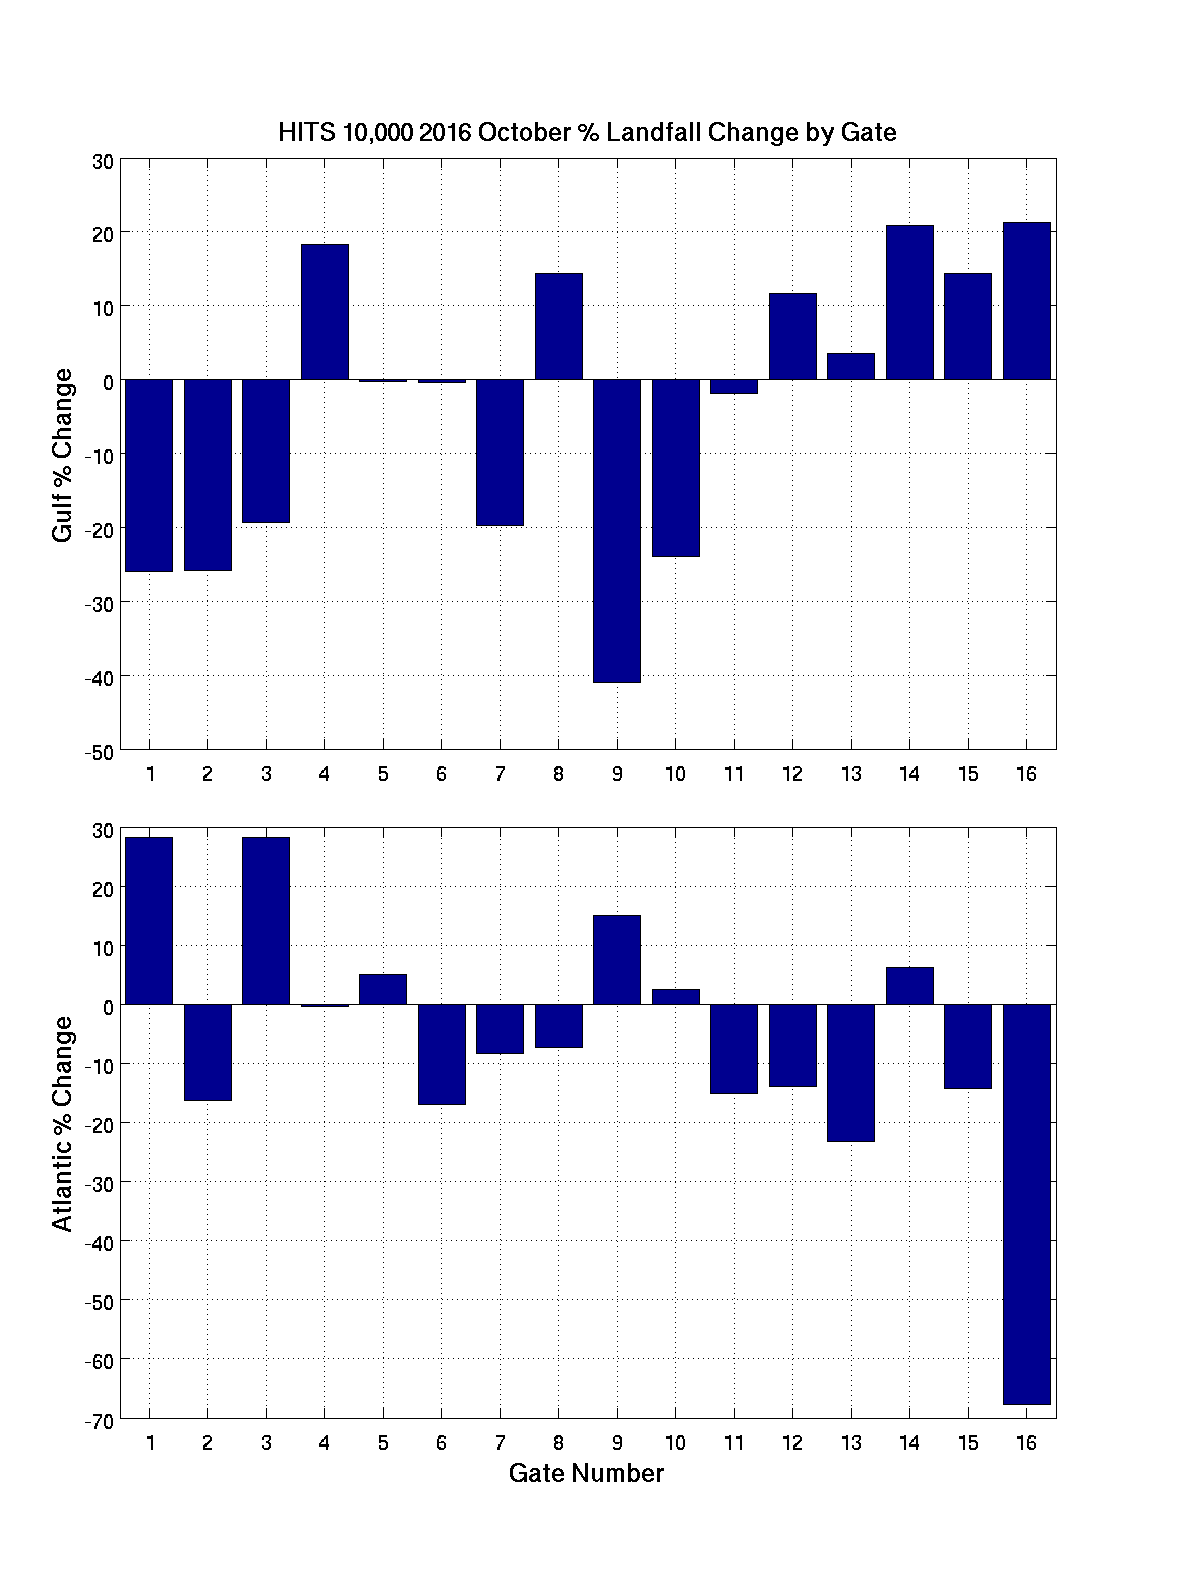
1000 simulations are run of all tracks that passed through the one degree box.
The 50th percentile (500th of the sorted 1000 simulations) of hurricane strength area (> 64 kt) and mainland landfalls are binned into 5 by 5 degree boxes
and plotted.
Hurricane strength area is in units of 6 hour residence.
Mainland landfall is defined as an ocean to land crossing.
A white map indicates the
50th percentile of the entire area is zero.
Zero contours are indicated by a dashed line.
Links:
Send e-mail to jennie at ldeo.columbia.edu
Sample Tracks HITS Original Model
Tar and zip file of N. Atlantic HITS tracks in netCDF format
HITStracksA.cdf: years 1-15,000
HITStracksB.cdf: years 15,001-30,000
HITStracksC.cdf: years 30,001-45,000
HITStracksD.cdf: years 45,001-60,000
Also available in Ingrid in a variety of file formats under the link "Data Downloads and Files"
HITStracksA
HITStracksB
HITStracksC
HITStracksD
storm - an identifier of storm number in each file
Obs - the variable value every 2 hours
numObs - total number of 2 hour Obs per storm
year - year of the storm (1 to 60,000)
center_lat - latitiude of center of storm in degree N
center_lon - longitude of center of storm in degree E
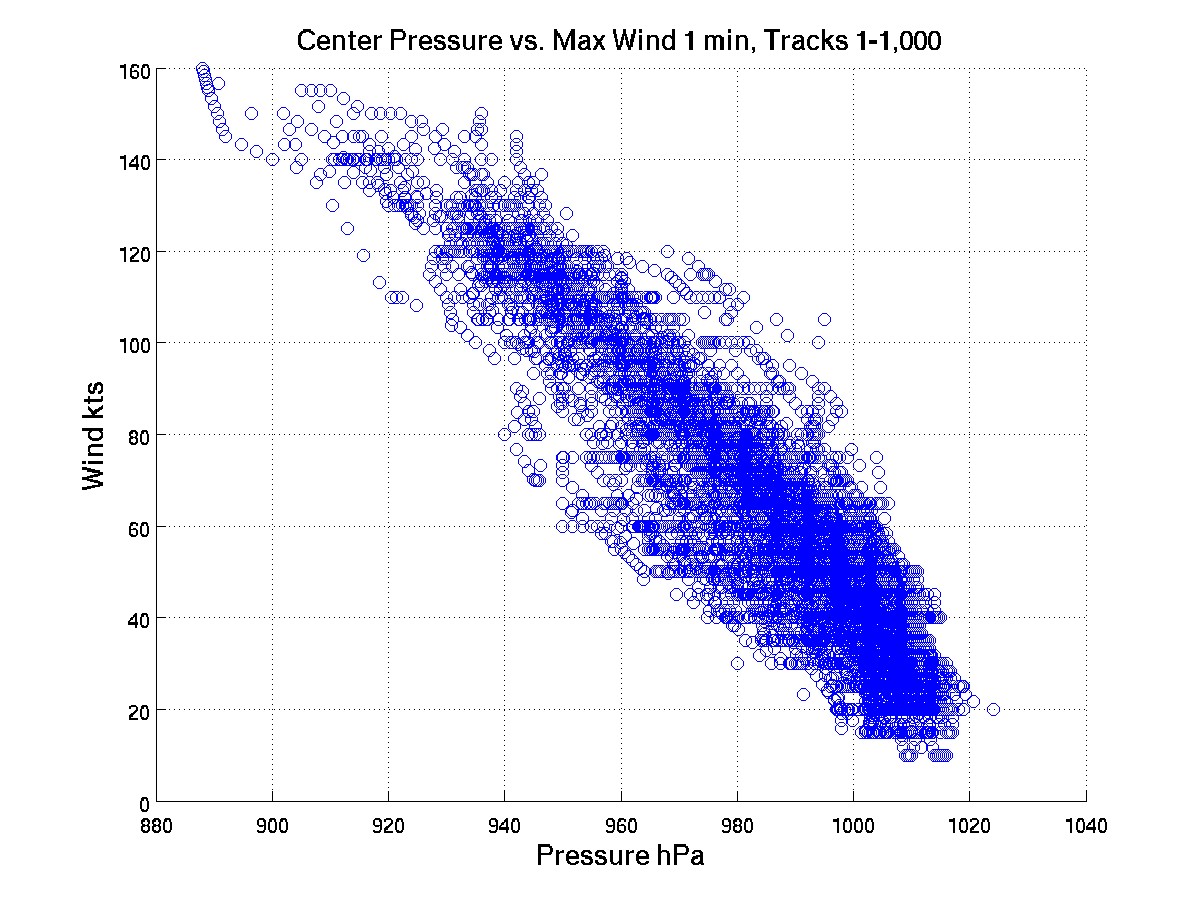
center_pressure - minimum pressure in hPa
max_wind_1min - maximum 1 minute sustained wind in kt
max_windgust_3sec_flatcoast - maximum 3 second wind gust in kt using flat coast surface conditions
max_windgust_3sec_openocean - maximum 3 second wind gust in kt using open ocean surface conditions
max_windgust_3sec_towncoast - maximum 3 second wind gust in kt using town or city on a coastline surface conditions
Ingrid plotting examples (these take up to a few minutes to load as files are large, click details and options for code)
Plotting
tracks in year 1000 with 1 min wind as colors (mask other years)
Plotting
tracks in years 1000-1050 with 1 min wind as colors
Plotting
all tracks in years 1-15,000 with 1 min wind as colors (this one takes the longest to plot)
Plotting starting locations of years 1-15,000 with color as 1 min wind
Plotting
tracks one at a time with 1 min wind as colors (click viewer to change track number)
Average 1 min winds in tracks 1000-1050
Tracks
1000-1050 storm center pressure vs. time (missing data in this variable as not every track segment carries that information)
Rainbow of the
random number of storms per year in years 1-15,000
1 min sustained to 3 second gust conversion formulas by:
Hsu, S. A., 2008: Estimating 3-second and maximum instantaneous gusts from 1-minute sustained wind speeds during a hurricane. Elecctr.
J. Struct. Engg, 77-79.
Hsu, S. A., Coastal Meteorology, Academic Press, 1988, p. 199-202.