Hydrology of Central and
![]()
Ingrid-based Data Catalog access to selected
Central and
![]()
The access to the Data Catalog of selected
Central and
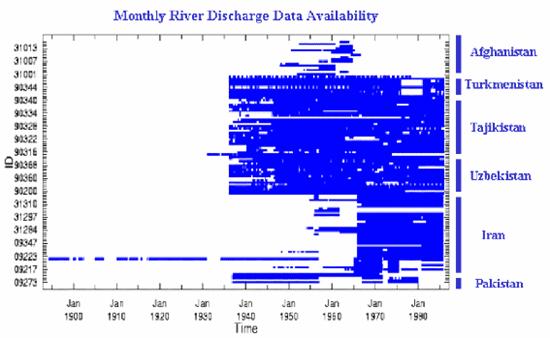
The data set of 112 monthly river streamflow records
for Central and Southwest (CSW) Asia extending from 1894 to 1985, was analyzed
(smoothed and interpolated) using the Reduced Space Optimal Interpolation
(RSOI) method. The majority of the observational records were available only
for the period after 1938. Monthly climatology for all stations were estimated for station-depended subperiods
of 1936-1984. Anomalies with regards to this climatology were normalized by the
annual climatological streamflow
for each station. These normalized anomalies were then subjected to the RSOI
analysis procedure. Month-dependent location-by-location covariance matrices
and empirical orthogonal functions were computed in order to apply the RSOI to
a subset of 84 stations for which these covariance matrices could be computed
for each calendar month. A technical novelty of the RSOI procedure was
developed and applied: the generalized cross-validation approach to the
simultaneous optimal selection of the reduced space dimension and the effective
relative observational error. Results of the analysis for 84 stations were presented
as normalized anomalies and converted back to the dimensional values with the climatological cycle included.
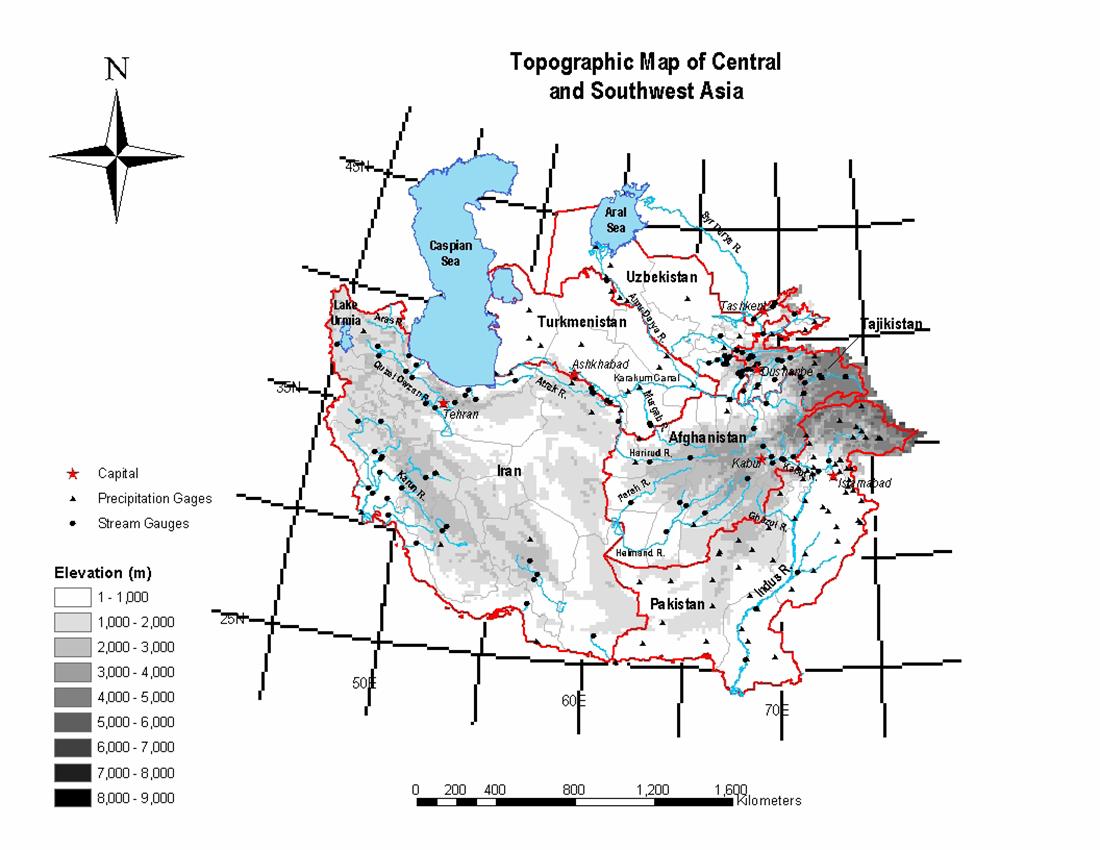
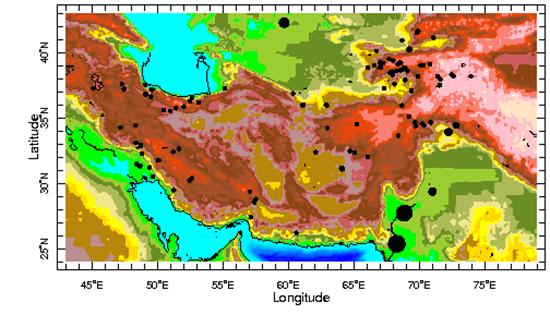
Locations of 112
river flow measurement stations. Sizes of circles are proportional to drainage
areas
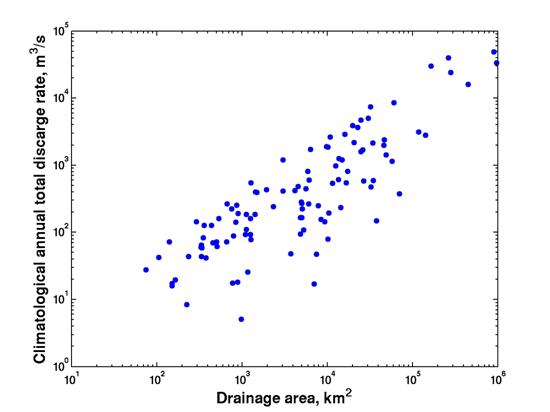
Climatological total discharge rates for
different stations vary by 4 order of magnitudes in a rough correspondence with
the discharge area; these climatological totals are
used for normalizing climatological and anomaly
records of riverflows
Standard deviations of binned normalized anomalies of 112 riverflow records: 1894-1985
Standard deviations of binned normalized anomalies of 84 riverflow
records subjected to the RSOI analysis: 1894-1985
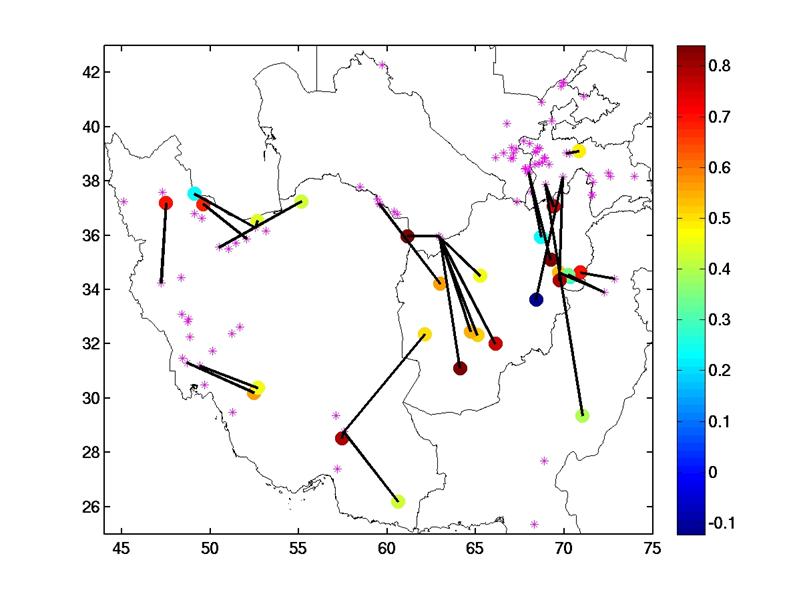
The 28 stations that could not be analyzed by the standard RSOI procedure
included all 16 Afghan stations, nine Iranian stations, and one station from
NN match of 28 stations (colored circles) omitted from the RSOI analysis to
the stations analyzed by the RSOI; color of circles indicates correlation
coefficients of target and matched stations
Standard deviations of binned normalized anomalies of 111 riverflow records from the RSOI analysis with NN regression
augmentation: 1894-1985
Standard deviations for months with available observations of binned
normalized anomalies of 111 riverflow records from
the RSOI analysis with NN regression augmentation
Climatological analysis of records from 112 river
flow stations in CSW Asia have shown a general progression of climatological cycle from the west to the east of the area,
with westernmost stations reaching their maximum flow in April-May and
easternmost stations achieving it in July-August. The data set was found to
exhibit strong geographical dependence in the type of climate variability and
the phase and shape of seasonal cycle. The East-West progression of seasonal
cycle in streamflows was characterized and connected
to the similar progression in precipitation.
Meridional mean of normalized climatology
for riverflows in CSW

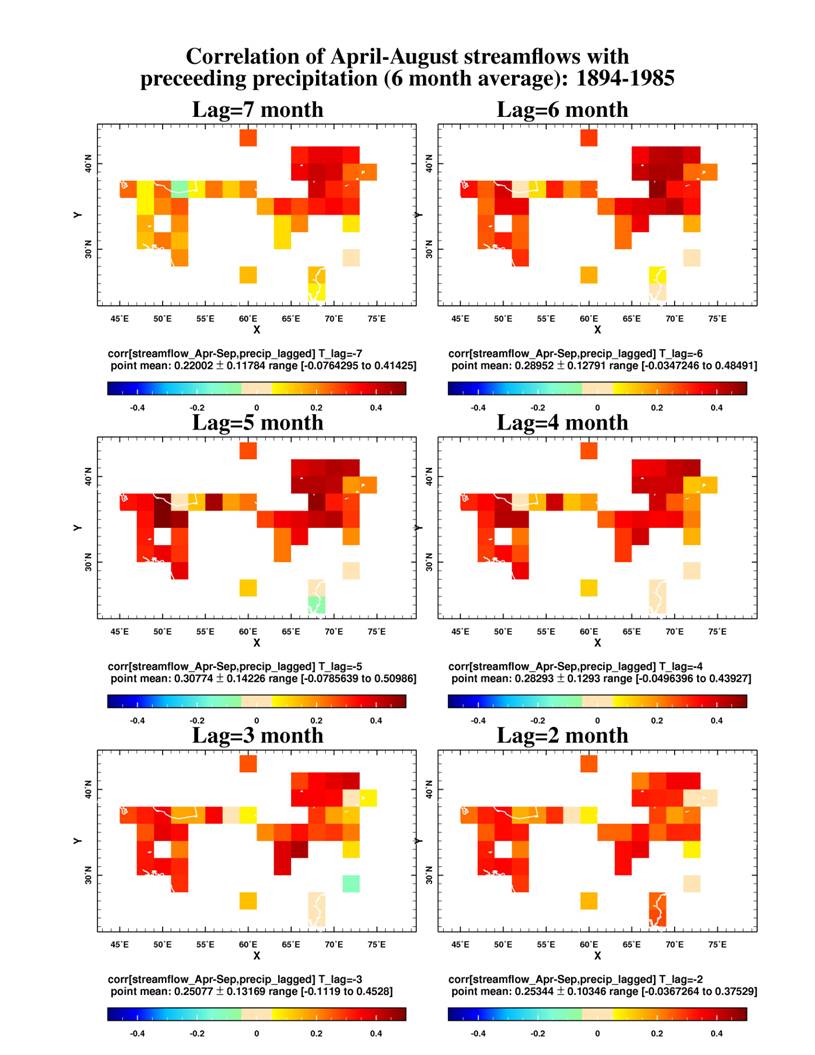
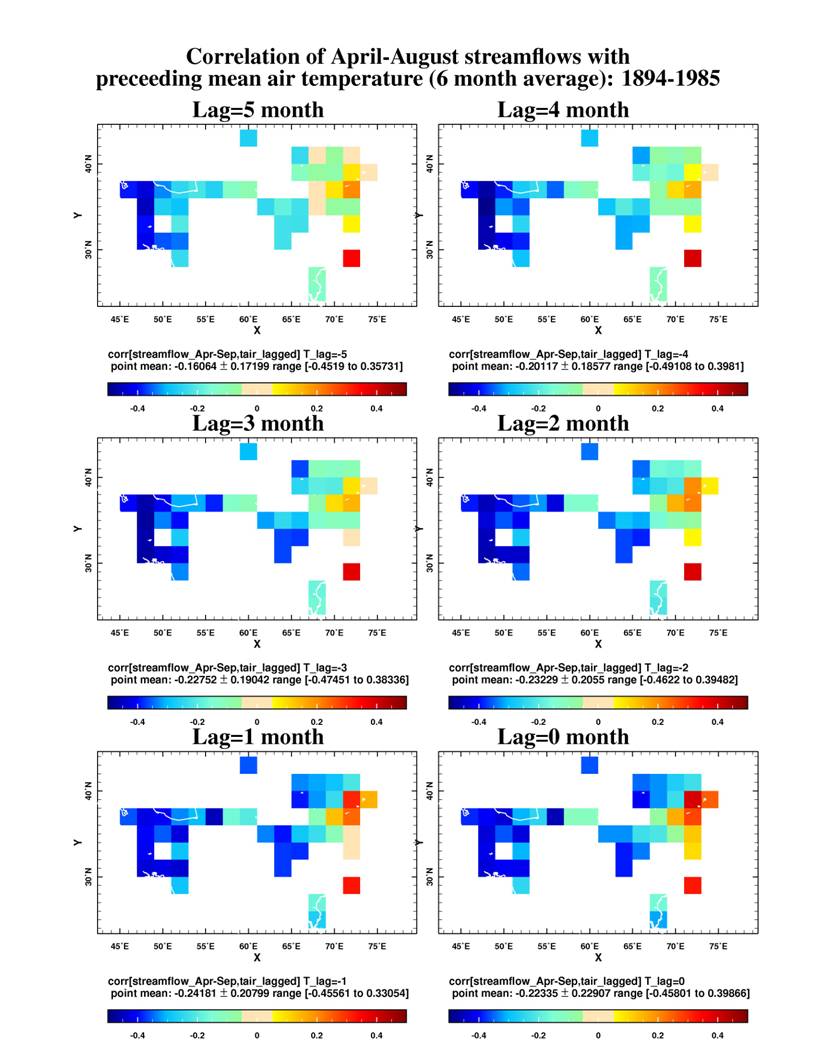
Comparison of analyzed gridded riverflow
anomalies for April-September period with a gridded
precipitation analysis of GHCN stations have shown their significant positive
correlations with lags from
![]()
Acknowledgement: Supported by the NSF grant
ATM02-33651 to A.Kaplan and M.K.Tippett
(LDEO of
![]()