Go Back to Earth Camp Course Notes Directory

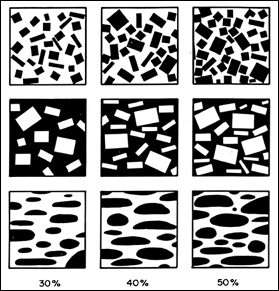
Figure 1b:
Chart for estimating the percentage of abundant mineral, fossil, or rock grains in a rock.

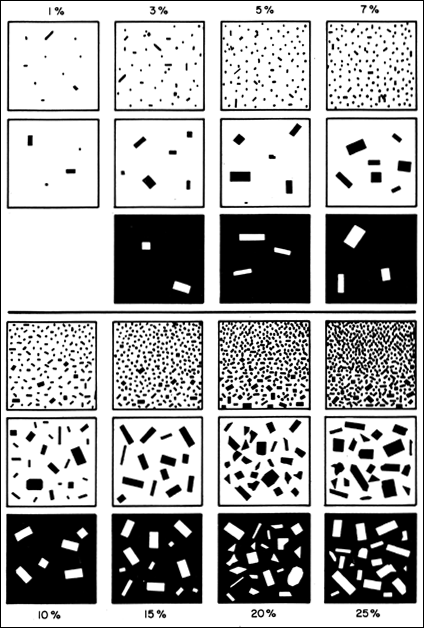
Figure 1a, B:
Charts for estimating the percentage of grains comprising 25% or less of a rock.both figures from Raymond, L. A., 1984, Petrography Laboratory Manual, vol. 1: Hand specimen Petrography. Geology Services International, NC, 170 p.
Go Back to Earth Camp Course Notes Directory